
Week 9-10 at GSOC: Implementing Bar3D Plots
As I reach the end of the tenth week of my Google Summer of Code (GSOC) project with LabPlot, I’m excited to share the advancements we’ve made in the realm of 3D plotting, specifically focusing on Bar3D plots. This period was dedicated to expanding LabPlot’s 3D plotting capabilities, allowing users to visualize numeric data in a more versatile and visually appealing manner.
Introducing Bar3D Plots
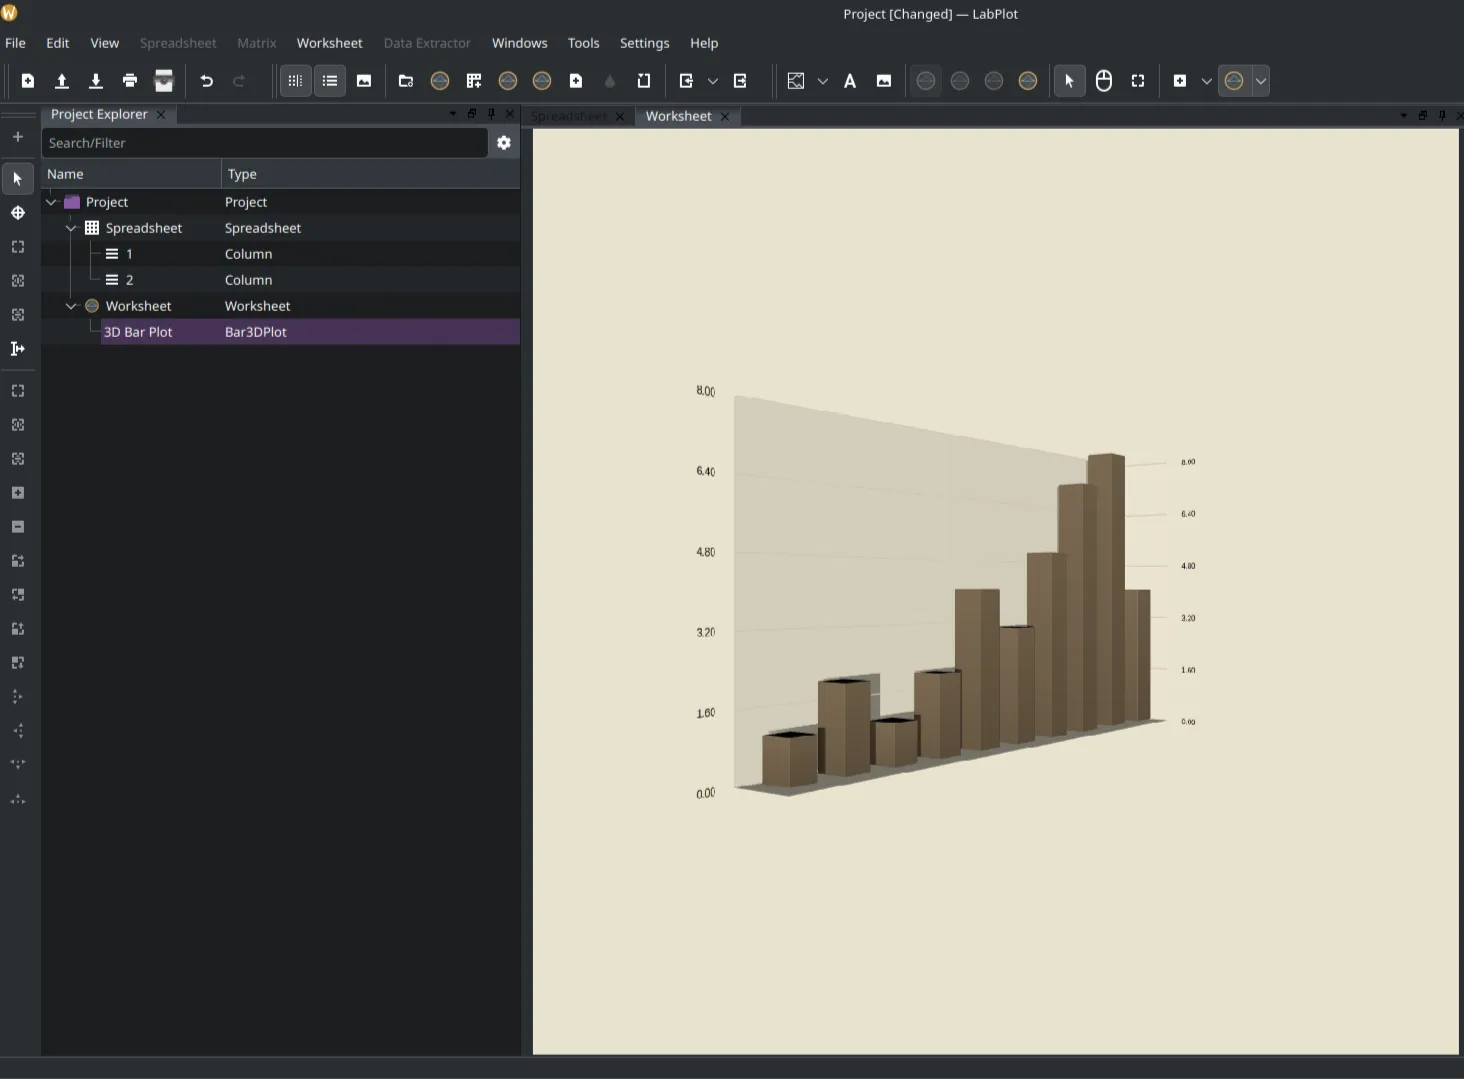
One of the key achievements in these weeks was the successful implementation of Bar3D plots. This new plot type allows users to represent numeric data from spreadsheet columns in a three-dimensional bar chart format. The Bar3D plot is especially useful for visualizing data distributions, comparisons, and trends across multiple categories or time periods.
Multi-Bar Plot Support
A significant enhancement to the Bar3D plot is the addition of multi-bar plot support. This feature enables users to plot multiple columns of data within the same 3D bar graph, providing a more comprehensive and comparative view of the data. Whether comparing sales figures across different regions or tracking performance metrics over time, the multi-bar plot feature offers users the flexibility to analyze multiple data sets simultaneously.
Enhancements and Customizations
To make the Bar3D plot even more user-friendly and customizable, several key features were implemented:
- Data Input from Spreadsheet Columns: Users can easily import numeric data from spreadsheet columns directly into the Bar3D plot, streamlining the process of data visualization.
- Bar Customization Options: Users can customize the appearance of the bars, including color, size, and spacing, to better suit their visualization needs.
- Interactive Exploration: The Bar3D plot integrates seamlessly with the existing 3D input handlers, allowing users to rotate, zoom, and pan the plot for a more interactive data exploration experience.
Challenges and Solutions
Implementing the Bar3D plot and multi-bar support was not without its challenges:
- Data Mapping: Ensuring that multiple columns of data are accurately mapped to the 3D bar plot required careful attention to detail and thorough testing.
- Performance Optimization: Handling large datasets in a 3D environment can be performance-intensive. We optimized the rendering process to maintain smooth interactions, even with complex multi-bar plots.
- User Interface Integration: Integrating the new Bar3D plot options into LabPlot’s existing interface required thoughtful design to ensure a seamless user experience.
Looking Ahead
With the Bar3D plot and multi-bar support successfully implemented, the next steps will focus on:
- Expanding Customization Options: Allowing users to further customize the appearance and behavior of the Bar3D plots.
- Real-Time Data Updates: Enhancing the Bar3D plot to support real-time data visualization, making it more dynamic and responsive to live data changes.
- User Feedback and Refinement: Gathering feedback from the LabPlot community to refine and enhance the new features, ensuring they meet the needs of a wide range of users.
The addition of Bar3D plots and multi-bar support marks a significant milestone in the GSOC project, bringing LabPlot closer to offering a comprehensive suite of 3D plotting tools. I’m excited to continue building on this foundation and to see how users will leverage these new capabilities in their data analysis workflows.
Stay tuned for more updates as we continue to push the boundaries of 3D visualization in LabPlot!