
Weeks 6-7 at GSOC: Enhancing Scatter Plot Features, Customization, and Performance in LabPlot
As I wrap up Weeks 6 and 7 of the Google Summer of Code (GSOC) project with LabPlot, I’m excited to share the significant advancements we’ve made. These weeks have been focused on refining scatter plot features, enhancing data input methods, implementing customizable mesh attributes, and addressing performance through data downsampling.
📈 Expanding Data Input Options
We’ve made substantial progress in improving how users input data into scatter plots:
- Spreadsheet Column Integration: Users can now directly import scatter plot data from columns in LabPlot’s spreadsheet, simplifying the visualization of tabular data.
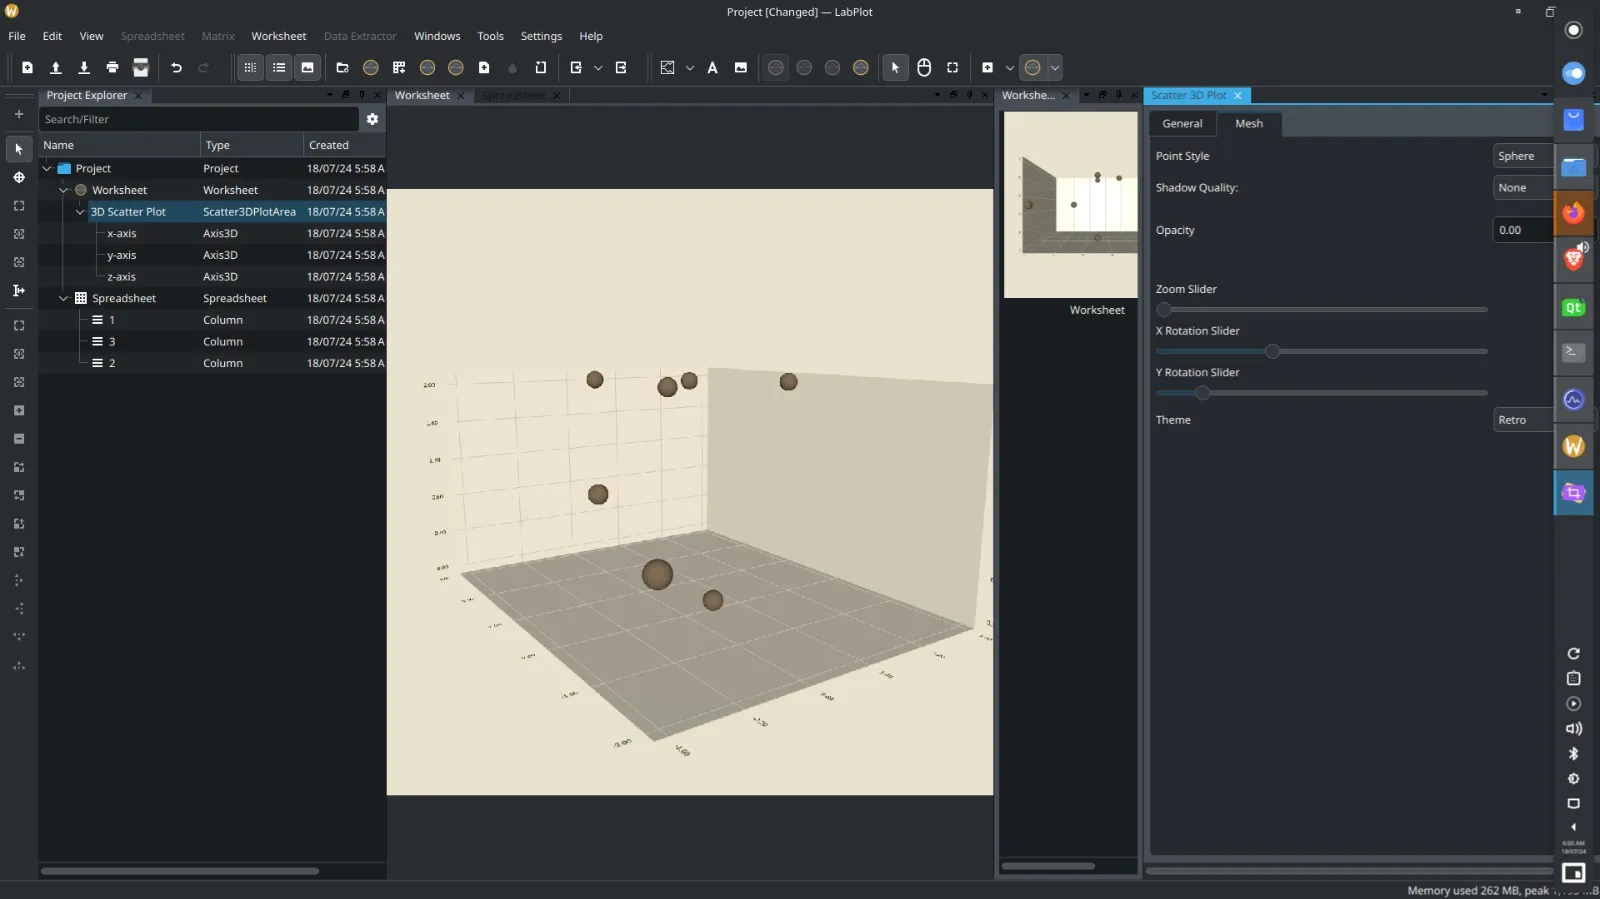
🎨 Visual Enhancements
Our enhancements to visual appeal and customization include:
Customizable Mesh Attributes: Users can now select from a range of shapes for scatter plot points, including:
- Sphere
- Cone
- Cube
- Cylinder
- Pyramid
These options enhance data visualization clarity and presentation.
🛠️ User Interface and Control Improvements
We’ve made key improvements to the user interface and control mechanisms:
Dockwidget Refinement: Updated to offer a more intuitive user experience for managing scatter plot properties.
Camera Parameter Controls: Users can now precisely adjust:
- Rotation along the X-axis
- Rotation along the Y-axis
- Zoom level
These controls enable better exploration and presentation of scatter plot data.
QSlider for Mesh Viewing: Introduced a QSlider that allows smooth adjustments to the scatter plot mesh, facilitating a more detailed examination of different perspectives.
⚙️ Performance Enhancements
To improve performance, we implemented data downsampling:
- Data Downsampling: Techniques were introduced to reduce the number of data points displayed, optimizing rendering performance and responsiveness, particularly with large datasets. Users can toggle downsampling to balance detail and performance based on their needs.
🔄 Additional Work and Refinements
Over these two weeks, we also focused on:
- Advanced Performance Optimization: Further refined rendering processes and performance optimization strategies to enhance efficiency.
- Enhanced Error Handling and Validation: Improved mechanisms for data validation and error handling to ensure robustness in data import and visualization.
- User Feedback Integration: Actively collected and analyzed user feedback to refine scatter plot features and interface improvements.
🔜 Next Steps
Looking ahead, our focus will be on:
- Feature Refinement: Continue enhancing scatter plot features based on ongoing user feedback.
- Advanced Data Handling: Explore additional methods for real-time data updates and further performance optimization.
- Improved Documentation: Develop comprehensive documentation to help users fully leverage the new scatter plot features and performance enhancements.
- Extended User Testing: Conduct further testing to validate the effectiveness and usability of the new features.
The progress made during these weeks has significantly advanced the functionality, customization, and performance of scatter plots in LabPlot. The addition of customizable mesh attributes, refined controls, and data downsampling represents a major leap forward in making scatter plots more versatile and efficient.
We’re excited to continue building on these developments and look forward to delivering even more powerful and interactive 3D plotting features. Stay tuned for further updates as we enhance LabPlot’s visualization capabilities!