
Week 5 at GSOC: Enhancing Data Input, Visualization, and User Control in LabPlot
As I wrap up my fifth week of the Google Summer of Code (GSOC) project with LabPlot, I’m thrilled to share the significant progress we’ve made in improving data input methods, enhancing the visual appeal of our 3D plots, and implementing more user controls. This week has been all about flexibility, user experience, aesthetic improvements, and increased interactivity.
Expanding Data Input Options
We’ve successfully implemented several new features to increase the flexibility of data input for 3D plotting:
- Spreadsheet Integration: Users can now directly input data from LabPlot’s spreadsheet into the 3D visualization.
- Matrix Input Support: We’ve added support for matrix input, providing another powerful option for data entry.
- Demo Curve Implementation: A preset visualization to help users get started quickly with 3D plotting in LabPlot.
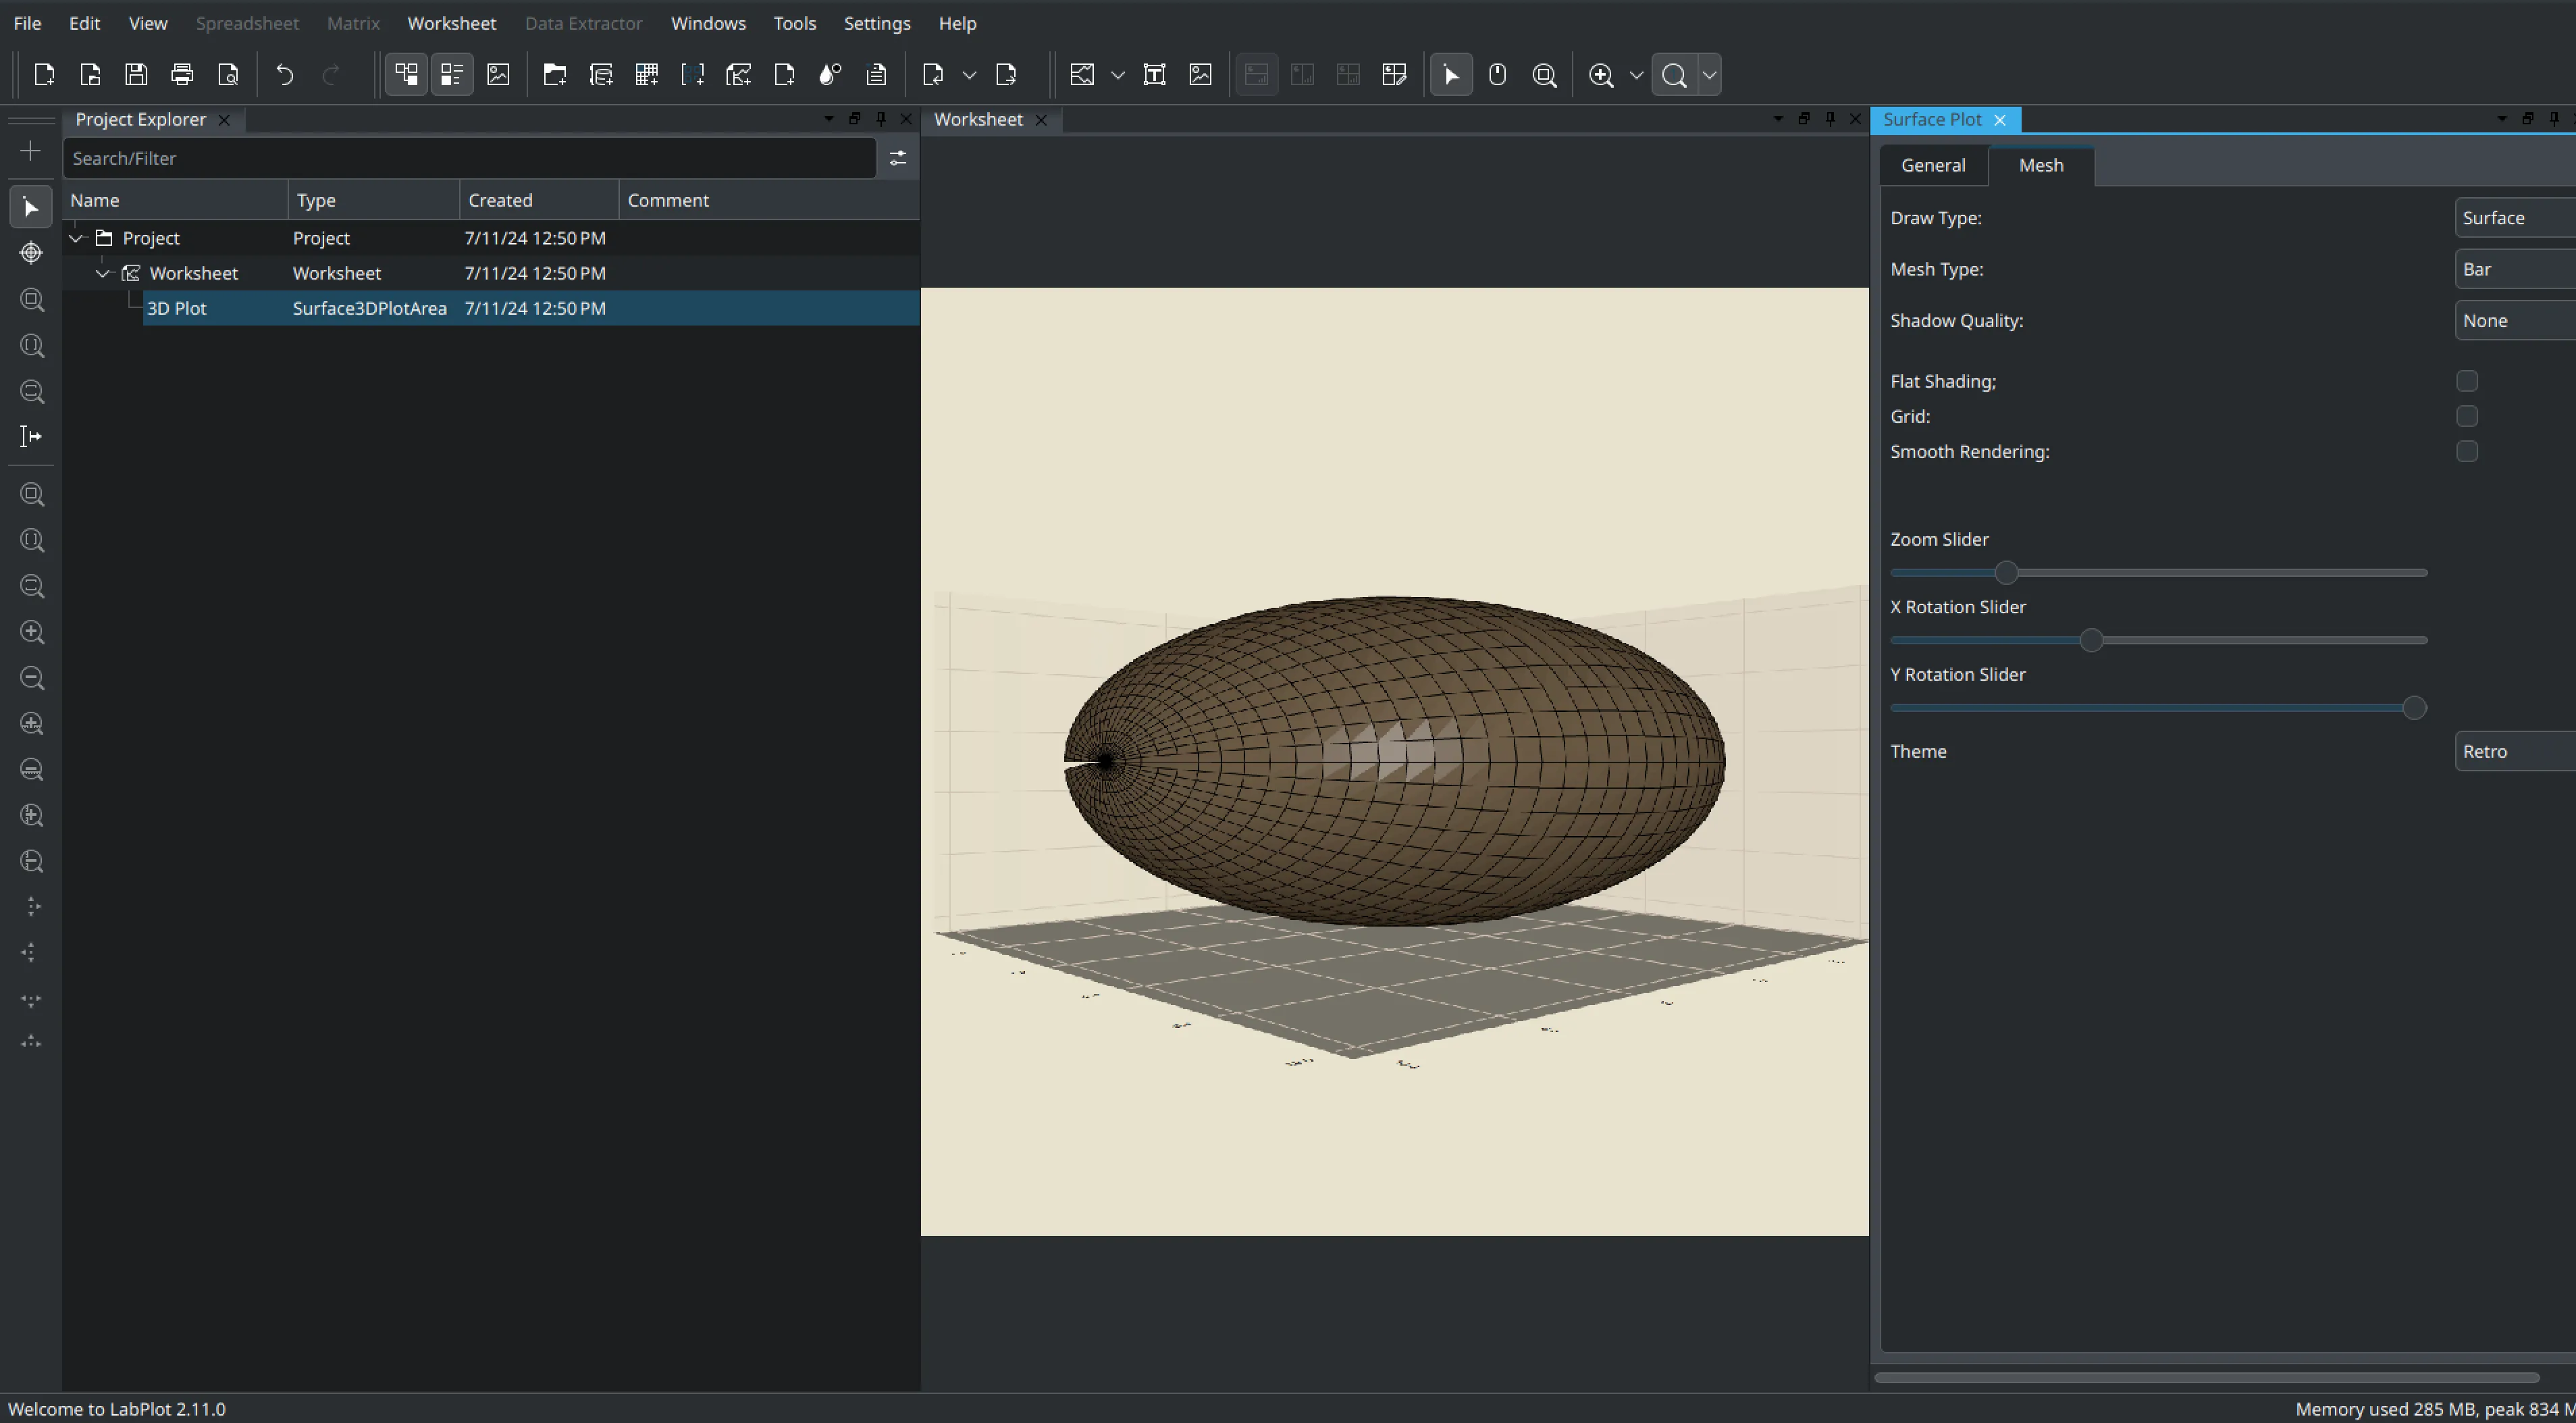
Visual Enhancements
Improving the visual appeal and customization options of our 3D plots was a key focus:
- Q3DThemes for Surfaces: We’ve implemented Q3DThemes for surface plots, allowing users to quickly change the overall look and feel of their visualizations.
User Interface and Control Improvements
We’ve made significant strides in enhancing user experience and control:
Dockwidget Refinement: We’ve revised the dockwidget that controls 3D plot properties for a more intuitive interface.
Camera Parameter Controls: A major addition this week was the implementation of camera parameter controls. Users can now adjust:
- Rotation along the X-axis
- Rotation along the Y-axis
- Zoom level
These controls give users fine-grained control over their view of the 3D plot, allowing for better exploration and presentation of the data.
QSlider for Surface Curve Viewing: We’ve implemented a QSlider that allows users to smoothly adjust their view of the surface curve. This slider provides an intuitive way to explore different cross-sections or angles of the 3D surface, enhancing the user’s ability to analyze and understand their data.
Challenges and Solutions
This week presented its own set of challenges:
- Data Synchronization: Ensuring smooth data flow from spreadsheets and matrices to the 3D visualization.
- Performance Optimization: Maintaining smooth user experience with new data input methods and interactive controls.
- Theme Integration: Implementing Q3DThemes while maintaining compatibility with existing customization options.
- Camera Control Implementation: Integrating camera controls seamlessly with the existing 3D rendering pipeline required careful coordination of different aspects of the visualization system.
Next Steps
As we move into the sixth week of the project, our focus will be on:
- Further refining the user interface based on initial feedback
- Implementing additional 3D plot types
- Enhancing data handling capabilities, including support for real-time data updates
- Improving documentation to help users make the most of the new 3D plotting features
- Expanding the range of interactive controls to give users even more ways to explore their 3D data
The progress we’ve made this week has significantly improved the functionality, user experience, and interactivity of LabPlot’s 3D visualization capabilities. The addition of camera controls and the surface curve slider, in particular, mark a big step forward in making our 3D plots more explorable and user-friendly.
We’re excited to continue building on this foundation and bringing even more powerful, interactive, and user-friendly 3D plotting features to LabPlot’s users. Stay tuned for more updates as we continue to enhance LabPlot’s visualization toolkit!