
Weeks 3 & 4 at GSOC: Expanding 3D Visualization in LabPlot
As I wrap up the third and fourth weeks of my Google Summer of Code (GSOC) project with LabPlot, I’m thrilled to share the substantial progress we’ve made in implementing and expanding 3D visualization capabilities. These two weeks have been packed with feature developments, UI improvements, and tackling various challenges.
Enhancing the Basic 3D Scene
Building on our initial implementation of a basic 3D scene, we’ve made several improvements:
| Feature | Description |
|---|---|
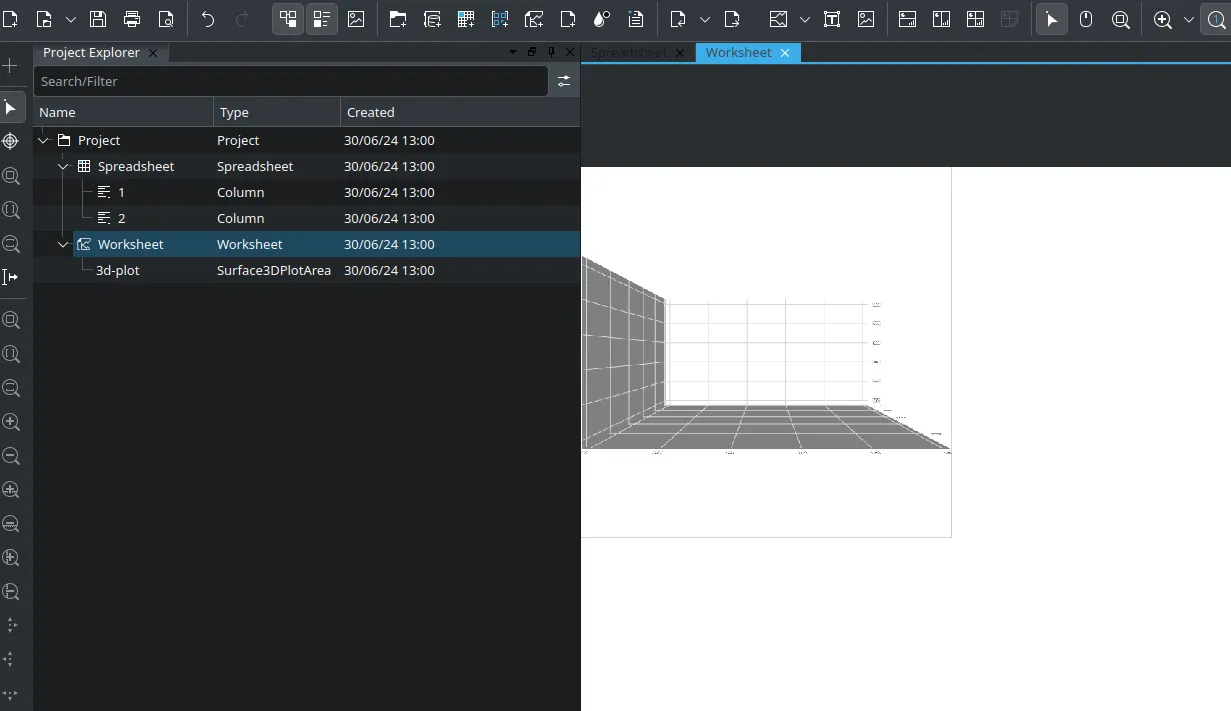
| Responsive Resizing | The 3D scene now supports resizing, adapting seamlessly to changes in the worksheet’s dimensions. |
| Surface Plot Support | Added support for surface plots, allowing visualization of 3D data in a continuous surface. |
User Interface Improvements
A significant portion of our work focused on enhancing the user interface to make 3D visualization more accessible and customizable:
Dock Widgets for Property Control
We’ve implemented dock widgets that allow users to modify various properties of the 3D scene:
| Property | Description |
|---|---|
| Mesh View | Changing the view of the mesh (wireframe, surface, or both). |
| Shadow Quality | Adjusting the quality of shadows cast by objects in the 3D scene. |
| Flat Shading | Enabling or disabling flat shading for objects in the 3D scene. |
| Toggle Shadows | Toggling the visibility of shadows in the 3D scene. |
| Mesh Smoothing | Smoothing the appearance of meshes in the 3D scene. |
| Enable Grid | Displaying a grid overlay on the 3D scene. |
Data Selection UI
We’ve created a user interface that allows selection of X, Y, and Z data from spreadsheets and matrices, making it easy to plot data in the 3D scene.
Backend Development
On the technical side, we’ve made significant strides in creating a robust backend for our 3D visualization feature:
Source Files
We’ve developed backend source files that handle core functionality such as data processing and scene management.
Interaction Files
We’ve created frontend interaction files that manage user inputs and update the 3D scene accordingly, ensuring smooth user interaction.
Challenges and Solutions
Throughout these two weeks, we encountered and overcame several challenges:
| Challenge | Solution |
|---|---|
| Performance Optimization | Optimized the rendering pipeline to ensure smooth performance during resizing and data updates. |
| UI/UX Design | Iterated on the design of 3D property controls based on user feedback, maintaining LabPlot’s clean interface. |
| Data Handling | Implemented a flexible system to handle different data sources and map them correctly to the 3D scene. |
Next Steps
As we move into the next phase of the project, our focus will be on:
- Refining the user interface based on initial feedback.
- Implementing additional 3D plot types, starting with scatter plots.
- Enhancing data handling capabilities to support larger datasets.
- Improving performance for complex 3D scenes.
The progress we’ve made over these two weeks has significantly advanced LabPlot’s 3D visualization capabilities. We’re excited to continue building on this foundation and bringing even more powerful 3D plotting features to LabPlot’s users.
Stay tuned for more updates as we continue to enhance LabPlot’s visualization toolkit!